Importing Data and Manipulating Data with Pandas
Outline
(1) Importing Data
(2) Indexing: loc and iloc
(3) Handling Missing Values
(4) Apply, Vectorized Function
(5) Merging Datasets
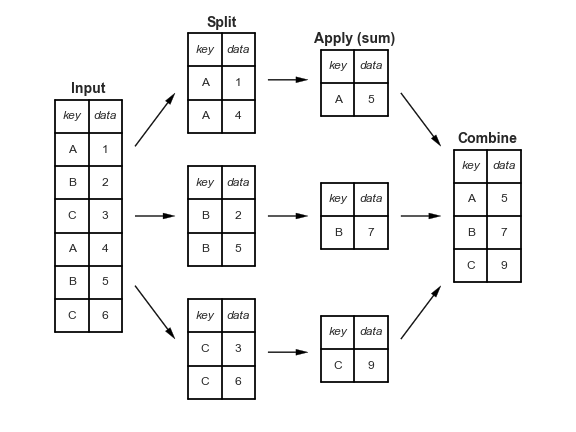
(6) Aggregating Data
In [53]:
import numpy as np
import pandas as pd
import os
os.getcwd()
Out[53]:
'/Users/hoyen/Desktop/STAT718-2026/PythonCode/PythonIntro'
In [37]:
dr = '/Users/hoyen/Desktop/STAT718-2026/PythonCode/PythonIntro/'
filename = 'df3.csv'
file = dr + filename
print(file)
/Users/hoyen/Desktop/STAT718-2026/PythonCode/PythonIntro/df3.csv
In [38]:
dat=pd.read_csv(file, header=0, index_col=0)
In [39]:
dat.head()
Out[39]:
| ENSG00000000003 | ENSG00000000005 | ENSG00000000419 | ENSG00000000457 | ENSG00000000460 | ENSG00000000938 | ENSG00000000971 | ENSG00000001036 | ENSG00000001084 | ENSG00000001167 | |
|---|---|---|---|---|---|---|---|---|---|---|
| ensgene | ||||||||||
| SRR1039508 | 723.0 | 0.0 | 467.0 | 347.0 | 96.0 | 0.0 | 3413.0 | 2328.0 | 670.0 | 426.0 |
| SRR1039509 | 486.0 | 0.0 | 523.0 | 258.0 | 81.0 | 0.0 | 3916.0 | 1714.0 | 372.0 | 295.0 |
| SRR1039512 | 904.0 | 0.0 | 616.0 | 364.0 | 73.0 | 1.0 | 6000.0 | 2640.0 | 692.0 | 531.0 |
| SRR1039513 | 445.0 | 0.0 | 371.0 | 237.0 | 66.0 | 0.0 | 4308.0 | 1381.0 | 448.0 | 178.0 |
| SRR1039516 | 1170.0 | 0.0 | 582.0 | 318.0 | 118.0 | 2.0 | 6424.0 | 2165.0 | 917.0 | 740.0 |
In [40]:
type(dat)
Out[40]:
pandas.core.frame.DataFrame
In [41]:
print(dat['ENSG00000000419'])
ensgene
SRR1039508    467.0
SRR1039509    523.0
SRR1039512    616.0
SRR1039513    371.0
SRR1039516    582.0
SRR1039517    781.0
SRR1039520    417.0
SRR1039521    509.0
Name: ENSG00000000419, dtype: float64
In [42]:
print(dat.ENSG00000000419) # # columns of Pandas data frames are called Series.
ensgene
SRR1039508    467.0
SRR1039509    523.0
SRR1039512    616.0
SRR1039513    371.0
SRR1039516    582.0
SRR1039517    781.0
SRR1039520    417.0
SRR1039521    509.0
Name: ENSG00000000419, dtype: float64
Indexer: loc and iloc
Label-based indexing with .loc
In [43]:
dat.loc[:, "ENSG00000000457"] # select one gene across all samples
Out[43]:
ensgene
SRR1039508    347.0
SRR1039509    258.0
SRR1039512    364.0
SRR1039513    237.0
SRR1039516    318.0
SRR1039517    447.0
SRR1039520    330.0
SRR1039521    324.0
Name: ENSG00000000457, dtype: float64
In [44]:
dat.loc["SRR1039509"] # one sample across all genes
Out[44]:
ENSG00000000003     486.0
ENSG00000000005       0.0
ENSG00000000419     523.0
ENSG00000000457     258.0
ENSG00000000460      81.0
ENSG00000000938       0.0
ENSG00000000971    3916.0
ENSG00000001036    1714.0
ENSG00000001084     372.0
ENSG00000001167     295.0
Name: SRR1039509, dtype: float64
In [45]:
dat.loc[["SRR1039512", "SRR1039521"], ["ENSG00000000005", "ENSG00000000457"]] ## select multiple genes and samples
Out[45]:
| ENSG00000000005 | ENSG00000000457 | |
|---|---|---|
| ensgene | ||
| SRR1039512 | 0.0 | 364.0 |
| SRR1039521 | 0.0 | 324.0 |
In [46]:
dat["ENSG00000000003"] < 1000
Out[46]:
ensgene
SRR1039508     True
SRR1039509     True
SRR1039512     True
SRR1039513     True
SRR1039516    False
SRR1039517    False
SRR1039520     True
SRR1039521     True
Name: ENSG00000000003, dtype: bool
In [47]:
dat.loc[dat["ENSG00000000003"] < 1000] ## Conditional selection with boolean filtering
Out[47]:
| ENSG00000000003 | ENSG00000000005 | ENSG00000000419 | ENSG00000000457 | ENSG00000000460 | ENSG00000000938 | ENSG00000000971 | ENSG00000001036 | ENSG00000001084 | ENSG00000001167 | |
|---|---|---|---|---|---|---|---|---|---|---|
| ensgene | ||||||||||
| SRR1039508 | 723.0 | 0.0 | 467.0 | 347.0 | 96.0 | 0.0 | 3413.0 | 2328.0 | 670.0 | 426.0 |
| SRR1039509 | 486.0 | 0.0 | 523.0 | 258.0 | 81.0 | 0.0 | 3916.0 | 1714.0 | 372.0 | 295.0 |
| SRR1039512 | 904.0 | 0.0 | 616.0 | 364.0 | 73.0 | 1.0 | 6000.0 | 2640.0 | 692.0 | 531.0 |
| SRR1039513 | 445.0 | 0.0 | 371.0 | 237.0 | 66.0 | 0.0 | 4308.0 | 1381.0 | 448.0 | 178.0 |
| SRR1039520 | 806.0 | 0.0 | 417.0 | 330.0 | 102.0 | 0.0 | 5039.0 | 2175.0 | 744.0 | 414.0 |
| SRR1039521 | 604.0 | 0.0 | 509.0 | 324.0 | 74.0 | 0.0 | 7803.0 | 1786.0 | 685.0 | 269.0 |
Integer-position-based indexing with .iloc
In [21]:
dat.iloc[:5,:5] # the first 5 rows and 5 columns
Out[21]:
| ENSG00000000003 | ENSG00000000005 | ENSG00000000419 | ENSG00000000457 | ENSG00000000460 | |
|---|---|---|---|---|---|
| ensgene | |||||
| SRR1039508 | 723.0 | 0.0 | 467.0 | 347.0 | 96.0 |
| SRR1039509 | 486.0 | 0.0 | 523.0 | 258.0 | 81.0 |
| SRR1039512 | 904.0 | 0.0 | 616.0 | 364.0 | 73.0 |
| SRR1039513 | 445.0 | 0.0 | 371.0 | 237.0 | 66.0 |
| SRR1039516 | 1170.0 | 0.0 | 582.0 | 318.0 | 118.0 |
| SRR1039517 | 1097.0 | 0.0 | 781.0 | 447.0 | 94.0 |
| SRR1039520 | 806.0 | 0.0 | 417.0 | 330.0 | 102.0 |
| SRR1039521 | 604.0 | 0.0 | 509.0 | 324.0 | 74.0 |
Handling missing values: isnull(), notnull(), dropna(), fillna()
In [48]:
dat.iloc[1,0]= None  ### or dat.iloc[1,0]= np.nan
dat.head()
Out[48]:
| ENSG00000000003 | ENSG00000000005 | ENSG00000000419 | ENSG00000000457 | ENSG00000000460 | ENSG00000000938 | ENSG00000000971 | ENSG00000001036 | ENSG00000001084 | ENSG00000001167 | |
|---|---|---|---|---|---|---|---|---|---|---|
| ensgene | ||||||||||
| SRR1039508 | 723.0 | 0.0 | 467.0 | 347.0 | 96.0 | 0.0 | 3413.0 | 2328.0 | 670.0 | 426.0 |
| SRR1039509 | NaN | 0.0 | 523.0 | 258.0 | 81.0 | 0.0 | 3916.0 | 1714.0 | 372.0 | 295.0 |
| SRR1039512 | 904.0 | 0.0 | 616.0 | 364.0 | 73.0 | 1.0 | 6000.0 | 2640.0 | 692.0 | 531.0 |
| SRR1039513 | 445.0 | 0.0 | 371.0 | 237.0 | 66.0 | 0.0 | 4308.0 | 1381.0 | 448.0 | 178.0 |
| SRR1039516 | 1170.0 | 0.0 | 582.0 | 318.0 | 118.0 | 2.0 | 6424.0 | 2165.0 | 917.0 | 740.0 |
In [53]:
dat.notna().loc["SRR1039509"]
Out[53]:
ENSG00000000003    False
ENSG00000000005     True
ENSG00000000419     True
ENSG00000000457     True
ENSG00000000460     True
ENSG00000000938     True
ENSG00000000971     True
ENSG00000001036     True
ENSG00000001084     True
ENSG00000001167     True
Name: SRR1039509, dtype: bool
In [55]:
dat.loc["SRR1039509"].dropna() ## drop the gene with NaN for one sample, this return a Pandas series
Out[55]:
ENSG00000000005       0.0
ENSG00000000419     523.0
ENSG00000000457     258.0
ENSG00000000460      81.0
ENSG00000000938       0.0
ENSG00000000971    3916.0
ENSG00000001036    1714.0
ENSG00000001084     372.0
ENSG00000001167     295.0
Name: SRR1039509, dtype: float64
In [57]:
dat2=dat.dropna() ## the entire SRR1039509 sample was dropped just due to a missing value in one gene!
dat2
Out[57]:
| ENSG00000000003 | ENSG00000000005 | ENSG00000000419 | ENSG00000000457 | ENSG00000000460 | ENSG00000000938 | ENSG00000000971 | ENSG00000001036 | ENSG00000001084 | ENSG00000001167 | |
|---|---|---|---|---|---|---|---|---|---|---|
| ensgene | ||||||||||
| SRR1039508 | 723.0 | 0.0 | 467.0 | 347.0 | 96.0 | 0.0 | 3413.0 | 2328.0 | 670.0 | 426.0 |
| SRR1039512 | 904.0 | 0.0 | 616.0 | 364.0 | 73.0 | 1.0 | 6000.0 | 2640.0 | 692.0 | 531.0 |
| SRR1039513 | 445.0 | 0.0 | 371.0 | 237.0 | 66.0 | 0.0 | 4308.0 | 1381.0 | 448.0 | 178.0 |
| SRR1039516 | 1170.0 | 0.0 | 582.0 | 318.0 | 118.0 | 2.0 | 6424.0 | 2165.0 | 917.0 | 740.0 |
| SRR1039517 | 1097.0 | 0.0 | 781.0 | 447.0 | 94.0 | 0.0 | 10723.0 | 2262.0 | 807.0 | 651.0 |
| SRR1039520 | 806.0 | 0.0 | 417.0 | 330.0 | 102.0 | 0.0 | 5039.0 | 2175.0 | 744.0 | 414.0 |
| SRR1039521 | 604.0 | 0.0 | 509.0 | 324.0 | 74.0 | 0.0 | 7803.0 | 1786.0 | 685.0 | 269.0 |
In [59]:
dat3=dat.dropna(axis=1) ## the entire gene (ENSG00000000003) was dropped just due to a missing value in one sample!
dat3
Out[59]:
| ENSG00000000005 | ENSG00000000419 | ENSG00000000457 | ENSG00000000460 | ENSG00000000938 | ENSG00000000971 | ENSG00000001036 | ENSG00000001084 | ENSG00000001167 | |
|---|---|---|---|---|---|---|---|---|---|
| ensgene | |||||||||
| SRR1039508 | 0.0 | 467.0 | 347.0 | 96.0 | 0.0 | 3413.0 | 2328.0 | 670.0 | 426.0 |
| SRR1039509 | 0.0 | 523.0 | 258.0 | 81.0 | 0.0 | 3916.0 | 1714.0 | 372.0 | 295.0 |
| SRR1039512 | 0.0 | 616.0 | 364.0 | 73.0 | 1.0 | 6000.0 | 2640.0 | 692.0 | 531.0 |
| SRR1039513 | 0.0 | 371.0 | 237.0 | 66.0 | 0.0 | 4308.0 | 1381.0 | 448.0 | 178.0 |
| SRR1039516 | 0.0 | 582.0 | 318.0 | 118.0 | 2.0 | 6424.0 | 2165.0 | 917.0 | 740.0 |
| SRR1039517 | 0.0 | 781.0 | 447.0 | 94.0 | 0.0 | 10723.0 | 2262.0 | 807.0 | 651.0 |
| SRR1039520 | 0.0 | 417.0 | 330.0 | 102.0 | 0.0 | 5039.0 | 2175.0 | 744.0 | 414.0 |
| SRR1039521 | 0.0 | 509.0 | 324.0 | 74.0 | 0.0 | 7803.0 | 1786.0 | 685.0 | 269.0 |
In [62]:
dat4=dat.dropna(axis=0, thresh=9) ## finer-grained control, the thresh parameter lets you specify a minimum number of non-null values for the row/column to be kept
dat4
Out[62]:
| ENSG00000000003 | ENSG00000000005 | ENSG00000000419 | ENSG00000000457 | ENSG00000000460 | ENSG00000000938 | ENSG00000000971 | ENSG00000001036 | ENSG00000001084 | ENSG00000001167 | |
|---|---|---|---|---|---|---|---|---|---|---|
| ensgene | ||||||||||
| SRR1039508 | 723.0 | 0.0 | 467.0 | 347.0 | 96.0 | 0.0 | 3413.0 | 2328.0 | 670.0 | 426.0 |
| SRR1039509 | NaN | 0.0 | 523.0 | 258.0 | 81.0 | 0.0 | 3916.0 | 1714.0 | 372.0 | 295.0 |
| SRR1039512 | 904.0 | 0.0 | 616.0 | 364.0 | 73.0 | 1.0 | 6000.0 | 2640.0 | 692.0 | 531.0 |
| SRR1039513 | 445.0 | 0.0 | 371.0 | 237.0 | 66.0 | 0.0 | 4308.0 | 1381.0 | 448.0 | 178.0 |
| SRR1039516 | 1170.0 | 0.0 | 582.0 | 318.0 | 118.0 | 2.0 | 6424.0 | 2165.0 | 917.0 | 740.0 |
| SRR1039517 | 1097.0 | 0.0 | 781.0 | 447.0 | 94.0 | 0.0 | 10723.0 | 2262.0 | 807.0 | 651.0 |
| SRR1039520 | 806.0 | 0.0 | 417.0 | 330.0 | 102.0 | 0.0 | 5039.0 | 2175.0 | 744.0 | 414.0 |
| SRR1039521 | 604.0 | 0.0 | 509.0 | 324.0 | 74.0 | 0.0 | 7803.0 | 1786.0 | 685.0 | 269.0 |
In [63]:
dat.mean(axis=0)
Out[63]:
ENSG00000000003     821.285714
ENSG00000000005       0.000000
ENSG00000000419     533.250000
ENSG00000000457     328.125000
ENSG00000000460      88.000000
ENSG00000000938       0.375000
ENSG00000000971    5953.250000
ENSG00000001036    2056.375000
ENSG00000001084     666.875000
ENSG00000001167     438.000000
dtype: float64
In [65]:
dat_filled = dat.fillna(dat.mean(axis=0))
dat_filled
Out[65]:
| ENSG00000000003 | ENSG00000000005 | ENSG00000000419 | ENSG00000000457 | ENSG00000000460 | ENSG00000000938 | ENSG00000000971 | ENSG00000001036 | ENSG00000001084 | ENSG00000001167 | |
|---|---|---|---|---|---|---|---|---|---|---|
| ensgene | ||||||||||
| SRR1039508 | 723.000000 | 0.0 | 467.0 | 347.0 | 96.0 | 0.0 | 3413.0 | 2328.0 | 670.0 | 426.0 |
| SRR1039509 | 821.285714 | 0.0 | 523.0 | 258.0 | 81.0 | 0.0 | 3916.0 | 1714.0 | 372.0 | 295.0 |
| SRR1039512 | 904.000000 | 0.0 | 616.0 | 364.0 | 73.0 | 1.0 | 6000.0 | 2640.0 | 692.0 | 531.0 |
| SRR1039513 | 445.000000 | 0.0 | 371.0 | 237.0 | 66.0 | 0.0 | 4308.0 | 1381.0 | 448.0 | 178.0 |
| SRR1039516 | 1170.000000 | 0.0 | 582.0 | 318.0 | 118.0 | 2.0 | 6424.0 | 2165.0 | 917.0 | 740.0 |
| SRR1039517 | 1097.000000 | 0.0 | 781.0 | 447.0 | 94.0 | 0.0 | 10723.0 | 2262.0 | 807.0 | 651.0 |
| SRR1039520 | 806.000000 | 0.0 | 417.0 | 330.0 | 102.0 | 0.0 | 5039.0 | 2175.0 | 744.0 | 414.0 |
| SRR1039521 | 604.000000 | 0.0 | 509.0 | 324.0 | 74.0 | 0.0 | 7803.0 | 1786.0 | 685.0 | 269.0 |
In [43]:
## Detecting missing value, calcuating missing percentage
In [65]:
url = "https://raw.githubusercontent.com/bioconnector/workshops/master/data/airway_scaledcounts.csv"  ## importing the gene expression data from a study
df2 = pd.read_csv(url, index_col=0)
df2.head()
df3=df2.T
df3.head()
Out[65]:
| ensgene | ENSG00000000003 | ENSG00000000005 | ENSG00000000419 | ENSG00000000457 | ENSG00000000460 | ENSG00000000938 | ENSG00000000971 | ENSG00000001036 | ENSG00000001084 | ENSG00000001167 | ... | ENSG00000283107 | ENSG00000283110 | ENSG00000283111 | ENSG00000283113 | ENSG00000283114 | ENSG00000283115 | ENSG00000283116 | ENSG00000283119 | ENSG00000283120 | ENSG00000283123 |
|---|---|---|---|---|---|---|---|---|---|---|---|---|---|---|---|---|---|---|---|---|---|
| SRR1039508 | 723.0 | 0.0 | 467.0 | 347.0 | 96.0 | 0.0 | 3413.0 | 2328.0 | 670.0 | 426.0 | ... | 0.0 | 0.0 | 0.0 | 0.0 | 0.0 | 0.0 | 0.0 | 0.0 | 1.0 | 0.0 |
| SRR1039509 | 486.0 | 0.0 | 523.0 | 258.0 | 81.0 | 0.0 | 3916.0 | 1714.0 | 372.0 | 295.0 | ... | 0.0 | 0.0 | 0.0 | 0.0 | 0.0 | 0.0 | 0.0 | 0.0 | 2.0 | 0.0 |
| SRR1039512 | 904.0 | 0.0 | 616.0 | 364.0 | 73.0 | 1.0 | 6000.0 | 2640.0 | 692.0 | 531.0 | ... | 0.0 | 0.0 | 0.0 | 0.0 | 0.0 | 0.0 | 0.0 | 0.0 | 1.0 | 0.0 |
| SRR1039513 | 445.0 | 0.0 | 371.0 | 237.0 | 66.0 | 0.0 | 4308.0 | 1381.0 | 448.0 | 178.0 | ... | 0.0 | 0.0 | 0.0 | 0.0 | 0.0 | 0.0 | 0.0 | 0.0 | 0.0 | 0.0 |
| SRR1039516 | 1170.0 | 0.0 | 582.0 | 318.0 | 118.0 | 2.0 | 6424.0 | 2165.0 | 917.0 | 740.0 | ... | 0.0 | 0.0 | 1.0 | 0.0 | 0.0 | 0.0 | 0.0 | 0.0 | 1.0 | 0.0 |
5 rows × 38694 columns
In [66]:
missing_mask = df3.isna() ## detect missing value for the whole data set
missing_mask
Out[66]:
| ensgene | ENSG00000000003 | ENSG00000000005 | ENSG00000000419 | ENSG00000000457 | ENSG00000000460 | ENSG00000000938 | ENSG00000000971 | ENSG00000001036 | ENSG00000001084 | ENSG00000001167 | ... | ENSG00000283107 | ENSG00000283110 | ENSG00000283111 | ENSG00000283113 | ENSG00000283114 | ENSG00000283115 | ENSG00000283116 | ENSG00000283119 | ENSG00000283120 | ENSG00000283123 |
|---|---|---|---|---|---|---|---|---|---|---|---|---|---|---|---|---|---|---|---|---|---|
| SRR1039508 | False | False | False | False | False | False | False | False | False | False | ... | False | False | False | False | False | False | False | False | False | False |
| SRR1039509 | False | False | False | False | False | False | False | False | False | False | ... | False | False | False | False | False | False | False | False | False | False |
| SRR1039512 | False | False | False | False | False | False | False | False | False | False | ... | False | False | False | False | False | False | False | False | False | False |
| SRR1039513 | False | False | False | False | False | False | False | False | False | False | ... | False | False | False | False | False | False | False | False | False | False |
| SRR1039516 | False | False | False | False | False | False | False | False | False | False | ... | False | False | False | False | False | False | False | False | False | False |
| SRR1039517 | False | False | False | False | False | False | False | False | False | False | ... | False | False | False | False | False | False | False | False | False | False |
| SRR1039520 | False | False | False | False | False | False | False | False | False | False | ... | False | False | False | False | False | False | False | False | False | False |
| SRR1039521 | False | False | False | False | False | False | False | False | False | False | ... | False | False | False | False | False | False | False | False | False | False |
8 rows × 38694 columns
In [67]:
sample_missing=missing_mask.sum(axis=1) ## convert boolen to numeric
sample_missing
Out[67]:
SRR1039508    0
SRR1039509    0
SRR1039512    0
SRR1039513    0
SRR1039516    0
SRR1039517    0
SRR1039520    0
SRR1039521    0
dtype: int64
A function to calculate zero-inflation rate per gene
In [68]:
def zero_inflation_rate(x):
    """
    Calculate zero-inflation rate for a gene.

    Parameters
    ----------
    x : pd.Series
        Expression values for one gene across samples

    Returns
    -------
    float
        Proportion of zero values among non-missing values
    """
    x = x.dropna()                  # remove missing values
    if len(x) == 0:
        return np.nan               # avoid division by zero
    return (x == 0).sum() / len(x)
Apply
In [70]:
zir_apply = df3.apply(zero_inflation_rate, axis=0) ### axis=0, collapse rows
zir_apply.shape
Out[70]:
(38694,)
Vectorized version zero-inflation rate per gene
In [71]:
zir_vec = (df3 == 0).sum(axis=0) / df3.notna().sum(axis=0)
np.allclose(zir_apply, zir_vec, equal_nan=True) ## double check
Out[71]:
True
In [72]:
import matplotlib.pyplot as plt

plt.figure()
plt.hist(zir_apply, bins=30)
plt.xlabel("Zero-inflation rate")
plt.ylabel("Number of genes")
plt.title("Histogram of Zero-inflation Rates per Gene")
plt.show()

subsetting genes with zero-inflation rate < 0.8
In [75]:
df4 = df3.loc[:, zir_apply<0.8]
df4.shape ### drop down to 22,627 genes
Out[75]:
(8, 22627)
Merging datasets: concat and append
Merging single-cell RNA-seq experiments from two batches
In [106]:
import anndata as ad

counts_A = pd.read_csv("adata1_counts.csv.gz", index_col=0, compression="gzip") ## read into data from batch A
counts_A.shape
Out[106]:
(2000, 300)
In [107]:
counts_B = pd.read_csv("adata2_counts.csv.gz", index_col=0, compression="gzip")
counts_B.shape
Out[107]:
(2000, 300)
In [108]:
counts_A.head()
Out[108]:
| A_cell0 | A_cell1 | A_cell2 | A_cell3 | A_cell4 | A_cell5 | A_cell6 | A_cell7 | A_cell8 | A_cell9 | ... | A_cell290 | A_cell291 | A_cell292 | A_cell293 | A_cell294 | A_cell295 | A_cell296 | A_cell297 | A_cell298 | A_cell299 | |
|---|---|---|---|---|---|---|---|---|---|---|---|---|---|---|---|---|---|---|---|---|---|
| Gene0 | 1 | 3 | 4 | 1 | 2 | 0 | 0 | 1 | 0 | 3 | ... | 3 | 4 | 3 | 3 | 1 | 1 | 5 | 1 | 2 | 1 |
| Gene1 | 4 | 2 | 13 | 0 | 3 | 2 | 3 | 2 | 0 | 1 | ... | 2 | 1 | 1 | 11 | 0 | 2 | 0 | 2 | 4 | 0 |
| Gene2 | 3 | 2 | 2 | 0 | 7 | 1 | 3 | 5 | 0 | 1 | ... | 1 | 4 | 2 | 2 | 0 | 2 | 1 | 0 | 0 | 4 |
| Gene3 | 0 | 2 | 1 | 0 | 2 | 2 | 3 | 1 | 2 | 1 | ... | 3 | 1 | 1 | 7 | 0 | 3 | 0 | 0 | 4 | 6 |
| Gene4 | 2 | 4 | 7 | 3 | 2 | 3 | 1 | 1 | 1 | 1 | ... | 0 | 5 | 7 | 5 | 1 | 8 | 5 | 0 | 6 | 0 |
5 rows × 300 columns
In [109]:
obs_A = pd.read_csv("adata1_cell_metadata.csv", index_col=0)
obs_B= pd.read_csv("adata2_cell_metadata.csv", index_col=0)
var = pd.read_csv("gene_metadata.csv", index_col=0)
obs_A.shape
Out[109]:
(300, 2)
In [110]:
obs_A.head()
Out[110]:
| batch | condition | |
|---|---|---|
| cell_id | ||
| A_cell0 | A | ctrl |
| A_cell1 | A | treat |
| A_cell2 | A | ctrl |
| A_cell3 | A | treat |
| A_cell4 | A | ctrl |
In [111]:
obs_A["batch"].value_counts()
Out[111]:
batch
A    300
Name: count, dtype: int64
In [112]:
obs_A["condition"].value_counts()
Out[112]:
condition
ctrl     150
treat    150
Name: count, dtype: int64
In [88]:
var.head()
Out[88]:
| Gene0 |
|---|
| Gene1 |
| Gene2 |
| Gene3 |
| Gene4 |
In [115]:
counts=pd.concat([counts_A, counts_B], axis=1, join="outer") ## axis=1 -> add samples, join="outer" -> keep all genes
counts.shape
Out[115]:
(2000, 600)
Merging two meta data
In [117]:
obs=pd.concat([obs_A, obs_B], axis=0, join="outer")
obs.shape
Out[117]:
(600, 2)
In [119]:
obs.head()
Out[119]:
| batch | condition | |
|---|---|---|
| cell_id | ||
| A_cell0 | A | ctrl |
| A_cell1 | A | treat |
| A_cell2 | A | ctrl |
| A_cell3 | A | treat |
| A_cell4 | A | ctrl |
In [120]:
pd.crosstab(obs["batch"], obs["condition"])
Out[120]:
| condition | ctrl | treat |
|---|---|---|
| batch | ||
| A | 150 | 150 |
| B | 150 | 150 |
In [122]:
#### Annotated data object for a single-cell experiment in Scanpy
In [121]:
adata = ad.AnnData(
    X=counts.T,
    obs=obs.loc[counts.columns],   # align cells
    var=var.loc[counts.index]       # align genes
)
adata
Out[121]:
AnnData object with n_obs × n_vars = 600 × 2000
    obs: 'batch', 'condition'
Aggregating data in Pandas
In [124]:
df4.head()
Out[124]:
| ensgene | ENSG00000000003 | ENSG00000000419 | ENSG00000000457 | ENSG00000000460 | ENSG00000000938 | ENSG00000000971 | ENSG00000001036 | ENSG00000001084 | ENSG00000001167 | ENSG00000001460 | ... | ENSG00000283087 | ENSG00000283088 | ENSG00000283091 | ENSG00000283094 | ENSG00000283099 | ENSG00000283100 | ENSG00000283101 | ENSG00000283104 | ENSG00000283111 | ENSG00000283120 |
|---|---|---|---|---|---|---|---|---|---|---|---|---|---|---|---|---|---|---|---|---|---|
| SRR1039508 | 723.0 | 467.0 | 347.0 | 96.0 | 0.0 | 3413.0 | 2328.0 | 670.0 | 426.0 | 191.0 | ... | 190.0 | 1.0 | 51.0 | 2187.0 | 0.0 | 647.0 | 3.0 | 71.0 | 0.0 | 1.0 |
| SRR1039509 | 486.0 | 523.0 | 258.0 | 81.0 | 0.0 | 3916.0 | 1714.0 | 372.0 | 295.0 | 182.0 | ... | 182.0 | 13.0 | 42.0 | 1536.0 | 0.0 | 570.0 | 3.0 | 70.0 | 0.0 | 2.0 |
| SRR1039512 | 904.0 | 616.0 | 364.0 | 73.0 | 1.0 | 6000.0 | 2640.0 | 692.0 | 531.0 | 287.0 | ... | 332.0 | 72.0 | 79.0 | 2491.0 | 0.0 | 645.0 | 9.0 | 116.0 | 0.0 | 1.0 |
| SRR1039513 | 445.0 | 371.0 | 237.0 | 66.0 | 0.0 | 4308.0 | 1381.0 | 448.0 | 178.0 | 137.0 | ... | 187.0 | 13.0 | 34.0 | 1253.0 | 1.0 | 369.0 | 10.0 | 45.0 | 0.0 | 0.0 |
| SRR1039516 | 1170.0 | 582.0 | 318.0 | 118.0 | 2.0 | 6424.0 | 2165.0 | 917.0 | 740.0 | 256.0 | ... | 332.0 | 47.0 | 87.0 | 2316.0 | 0.0 | 688.0 | 4.0 | 95.0 | 1.0 | 1.0 |
5 rows × 22627 columns
In [125]:
#### calculate the mean for each gene
gene_mean=df4.mean(axis=0) ## collapsing the rows
gene_mean.head()
Out[125]:
ensgene
ENSG00000000003    779.375
ENSG00000000419    533.250
ENSG00000000457    328.125
ENSG00000000460     88.000
ENSG00000000938      0.375
dtype: float64
In [127]:
obs.head()
Out[127]:
| batch | condition | |
|---|---|---|
| cell_id | ||
| A_cell0 | A | ctrl |
| A_cell1 | A | treat |
| A_cell2 | A | ctrl |
| A_cell3 | A | treat |
| A_cell4 | A | ctrl |
In [129]:
batch = obs["batch"]
batch.shape
Out[129]:
(600,)
In [136]:
gene_batch_mean=counts.groupby(batch, axis=1).mean()
gene_batch_mean.head()
/var/folders/kp/4rq4gv392szf4h4dx523w7s4_rl2wj/T/ipykernel_98485/2968416828.py:1: FutureWarning: DataFrame.groupby with axis=1 is deprecated. Do `frame.T.groupby(...)` without axis instead.
  gene_batch_mean=counts.groupby(batch, axis=1).mean()
Out[136]:
| batch | A | B |
|---|---|---|
| Gene0 | 1.980000 | 3.260000 |
| Gene1 | 3.253333 | 4.166667 |
| Gene2 | 2.003333 | 3.056667 |
| Gene3 | 1.753333 | 2.373333 |
| Gene4 | 3.340000 | 4.923333 |