Crowdstrike ($CRWD) stock has been on an impressive run – up 160% over the past 12 months. In fact, this is only surpassed by a single NASDAQ company over that time (Tesla). Its IPO was less than two years ago, and the enterprise value has since grown to $46B. The business has equally been on fire – annualized recurring revenue (ARR) has gone 8X in three years (~100% CAGR), while customer gross dollar retention is 98%, and net dollar retention has been consistently above 120%. Priced at 44X current ARR though, it seems inevitable that growth will slow, and the valuation will compress over time. That leaves an important question – is this still a good investment going forward?
CRWD is a cloud native platform that does everything from endpoint protection to threat intelligence to cloud workload security. I am not going to dive into the business specifics as other people can explain it much better than myself. Listen to the product or analyst presentations, or better yet, go read this deep dive from Muji. The company labels itself as a “category defining cloud platform” for security, akin to Salesforce ($CRM) for customer relationship management, ServiceNow ($NOW) for IT service management, or Workday ($WDAY) for human resources. Those three cloud companies are a few years ahead of CRWD on their revenue trajectory, so they offer a good study for how some of the key metrics compare and may evolve.
Anyone interested in enterprise software should study Salesforce. They have been around for a long time and have proven the durable revenue growth of cloud software, albeit aided by numerous acquisitions in recent years. They also have helped many to understand the business model and unit economics. Their analyst day presentations outline some useful metrics worth studying:
Attrition (“churn”, or 1 - retention): percentage of recurring revenue that does not renew.
Cost to book (“sales efficiency”): the cost to acquire new recurring revenue.
Cost to serve (“operating efficiency”): the ongoing costs to serve that recurring revenue.
I decided to look at these metrics for CRWD in comparison to CRM, NOW, and WDAY. Since CRWD currently has $1B ARR, I took the nearest annual year data when the other three had that same ARR. Note: they do not report ARR, so I took 4X Q4 subscription revenue. These companies also typically report fiscal years that end in January, but I am labeling them in charts as the calendar year those approximate. Examining CRWD currently is like looking at CRM in 2008, or NOW/WDAY in 2015. Here are how the growth trajectories of ARR look, with year zero being when the company hit ~$1B ARR.
Only NOW and CRWD report gross retention and they are the best at 2-3% attrition over the past few years. WDAY has stated at various times that gross retention is 95%+ so I have assumed 5% attrition for them historically. CRM in the early days apparently had mid-teens attrition but over the past decade has averaged 8-10%. However, the intrinsic value of NOW is already very high compared to its market price.
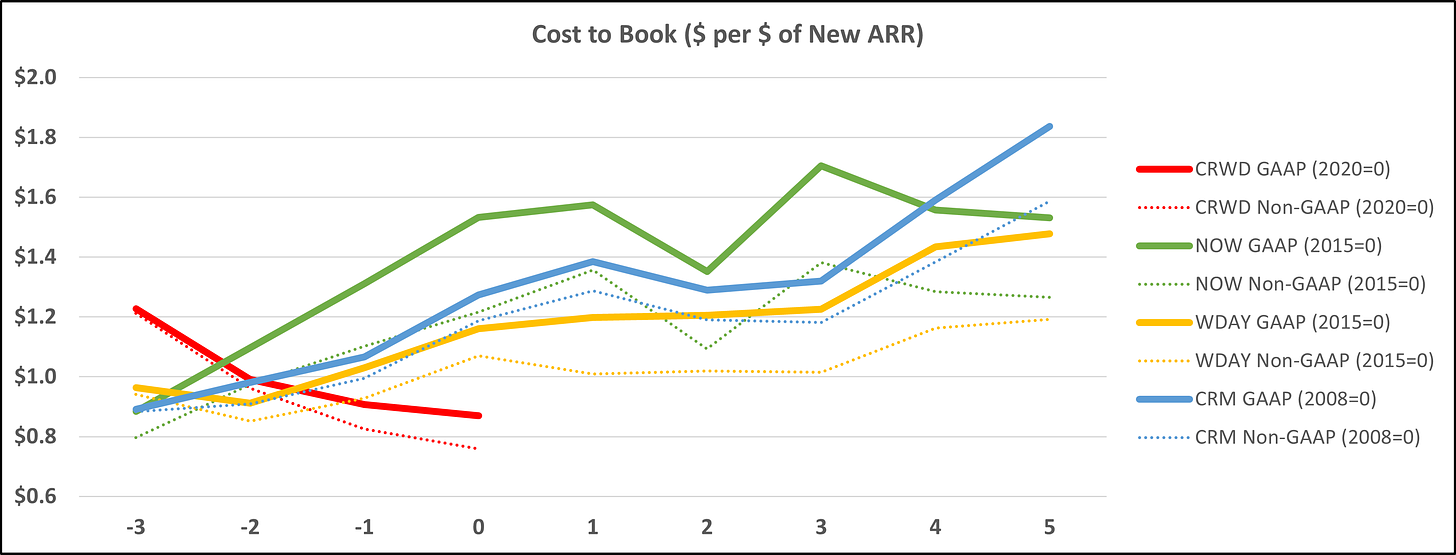
I calculated cost to book as all the sales and marketing spend divided by the new ARR. This factors in lost ARR due to attrition and acquired ARR from acquisitions for some of the major historical deals (CRM – Tableau, MuleSoft, Demandware, ExactTarget, ClickSoftware, WDAY – Adaptive Insights). This methodology also helps blend both new ARR that is from new customers as well as expansion ARR from existing customers, for a good overall sales efficiency. Both GAAP and Non-GAAP are plotted below.
CRWD has had declining costs to book in the years leading to $1B ARR while the others all had rising costs to book. Also, noteworthy that they have the best sales efficiency at $1B ARR. This data is helpful to think about what the metric might look like for CRWD in 5 years. The others averaged about a 20% higher cost to book 5 years later, although NOW is basically flat after being the highest at $1B ARR.
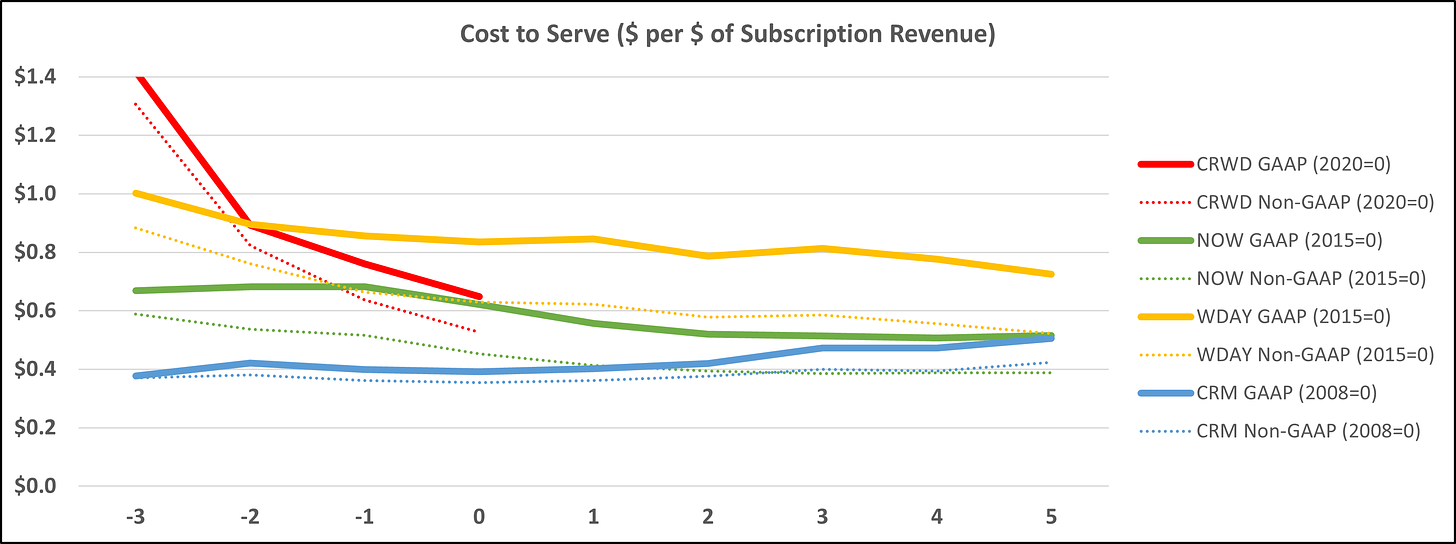
I calculated cost to serve as (Subscription Cost of Revenues + R&D + G&A) / Subscription Revenues. This is simple to pull from the financial statements. Again, both GAAP and Non-GAAP plotted below:
CRWD is in line with NOW, while better than WDAY and worse than CRM from a cost to serve standpoint at $1B ARR. This chart should show the operational leverage in the business model over time. Interestingly, NOW and WDAY both had about a 15% drop in cost to serve in the 5 years following, while CRM rose 20% (although starting from the lowest absolute level). While CRM did see operational leverage in G&A spend, it has been dwarfed by rising R&D spend as a percentage of revenue. CRM has been a serial acquirer and broadened their product offerings, hence the increase in R&D spending. Currently the WACC of Crowdstrike is only 7.4% as well
Now, jumping back to the Salesforce unit economics lesson – these metrics (attrition, CTB, CTS) can help us calculate what the limit of profitability would be. Basically, this implies what margins would be if growth goes away. This frontier as they describe it illustrates the trade off between growth and margins. See the illustration below:
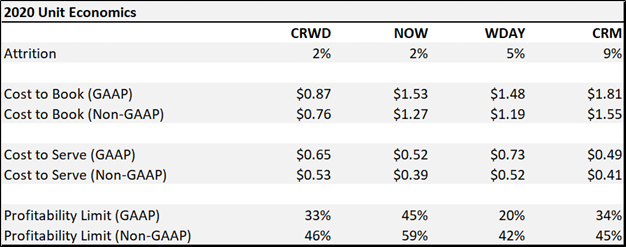
Putting it all together for the four companies in the table below, we see that the limits of profitability for 2020 range 20-45% on a GAAP basis, and 42-59% on a non-GAAP basis. Salesforce does not explicitly say what internal data (non-public) they use for these calculations but their estimate as of Q3 2020 was 39% so good to know I am in the right ballpark.
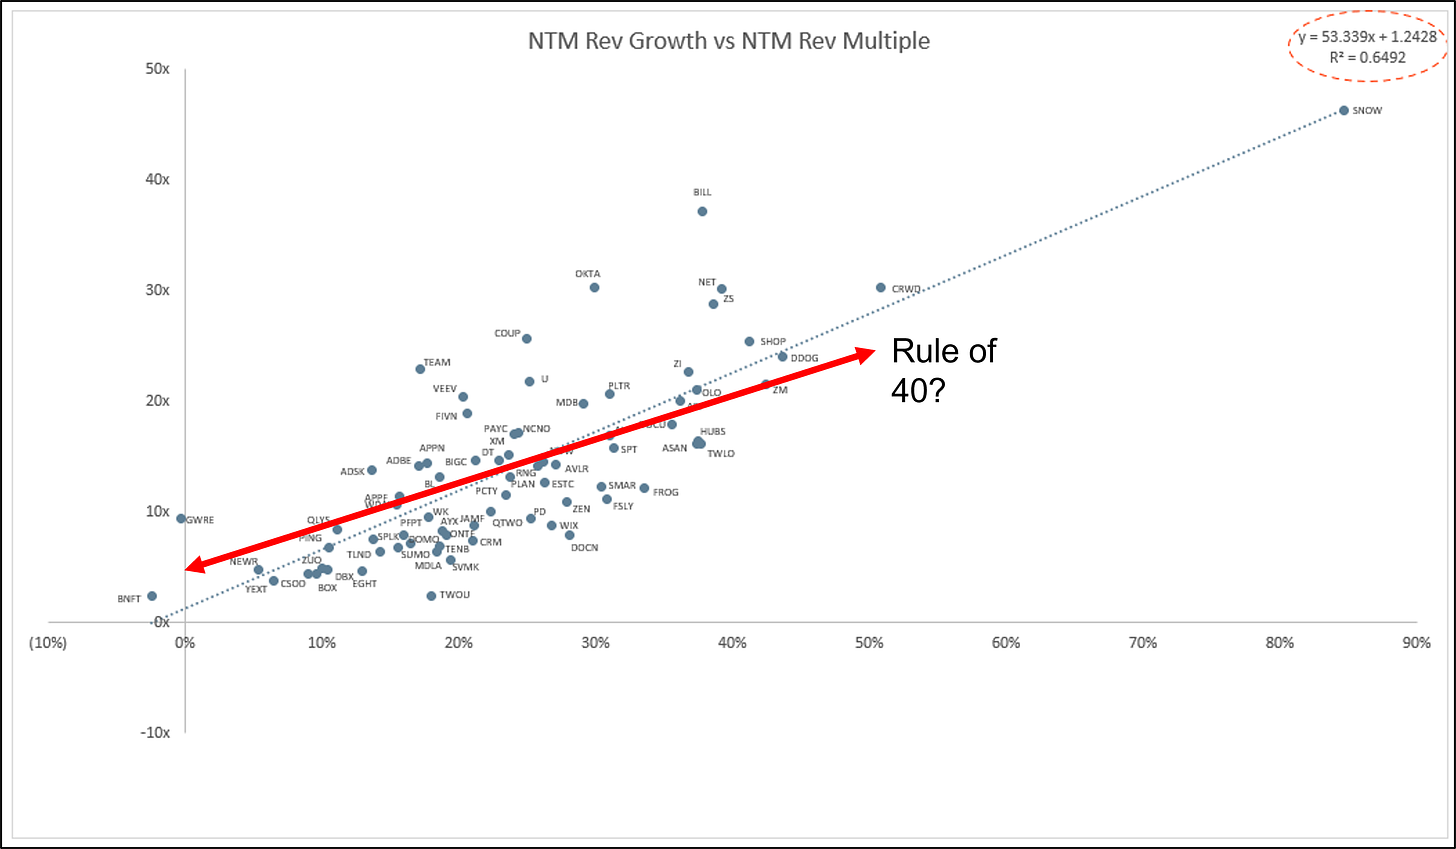
So back to the original question: is CRWD still a good investment going forward? Valuation exercises seem to be half science, half art. To accurately calculate the intrinsic value (by discounting all future cash flows to present), is fraught with sensitive input and projection assumptions. VMWare, CRWD's main competition, is going strong financially as well with its DCF valuation reports a 19.2% percent discount. Using multiples to estimate a valuation is equally wishy washy but allows for relative comparisons while thinking through the growth rates and changes in unit economics. SAAS companies tend to get valued off a multiple of revenues, as their business models are similar. These multiples are obviously sensitive to growth rates. Jamin Ball puts out a great weekly update on sentiment indicators. Here is a chart from 5/14:
Besides looking at CRWD under the scope of value investing we can also look at the regression results. It plots forward EV/Sales multiples versus projected revenue growth. The best fit line here has a slope of 53. Theoretically there should be some floor to a valuation multiple, meaning say for 0% growth a company should have a 10X earnings multiple. Well, if the profitability limit is 40% then that implies a 4X sales multiple floor. Conversely, high projected growth companies have a lot of embedded expectations that they still need to prove out so mentally handicapping the highfliers seems justified. Taking these two assumptions and drawing a new fit line (see red above) flattens the slope a bit and illustrates how we can use the Rule of 40, or the margin frontier, to assign valuation multiples as well. A higher profitability limit from the earlier calculations should, in theory, set a higher floor on the valuation and steepen the slope of the growth versus valuation tradeoff.
Scenario Analysis:
It is useful to lay out some different scenarios and probabilities as the future is clearly uncertain. I will show them via four different five-year projections.
For the worst case, CRWD or a major customer could get hacked and/or the business fundamentally deteriorates. This is a very unlikely scenario and I assign a 5% probability for the enterprise value to drop 75% over five years.
ARR adds at the current add rate ($450M/year) implying a forward ARR in five years of $3.8B. This would entail a deteriorating sales efficiency, no TAM expansion, no increased focus on security cloud spending, and stronger competition. I assign a 15% probability here.
Base case – ARR growth diminishes at the typical SAAS endurance level, meaning the growth rates each year are about 80% of the prior year. Bessemer has some great charts illustrating this trend here (slides 44-45). This leads to a forward ARR in five years of $6.7B. This entails some worsening sales efficiency (typical at scale), but improvements in operational leverage. I assign a 65% probability here.
ARR growth is strong, CRWD hits the 10X opportunity they have been talking about, and forward ARR in five years is $10.5B. This would represent a tremendous CAGR of 47% over that time. A lot of things would need to go right – secular push towards more cybersecurity spend, adjacent product developments in zero trust and observability, no major competitive threats emerge, etc. I assign a 15% probability here.
Looking at the scenarios shows a weighted enterprise value of $88B in five years. That equates to a 14% IRR, slightly above the most likely scenario (#3). There is obviously a lot of subjectivity in the forward ARR multiples. Keep in mind that there will be significant dilution going forward so mentally need to take off about 3% of the IRR for stock-based compensation. What I infer from this breakdown is that it seems likely CRWD can provide a market type return (11% annually), with some chance for a return significantly better than that (say 27% annually). And if held for 5+ years, unlikely to lead to any significant capital loss.
CRWD has the fastest growth at $1B ARR and some of the best sales efficiency compared to NOW, WDAY, and CRM. And for some final thoughts, the market for cybersecurity is primed for a ramp in spending right now. As digital transformation has accelerated during the pandemic, this should be a key item for enterprise executives. Just look at this list of hacks making the news in the past six months:
SolarWinds software hacked and spread to 18,000 clients
Colonial Pipeline shut down after ransomware attack
Microsoft exchange servers breached, impacting servers for 30,000 US organizations
CNA, a major insurance company that even offers cyber insurance, paid $40M after they themselves suffered a ransomware attack


